File:Difusióndeideas.svg
Jump to navigation
Jump to search

Size of this PNG preview of this SVG file: 800 × 564 pixels. Other resolutions: 320 × 225 pixels | 640 × 451 pixels | 1,024 × 721 pixels | 1,280 × 902 pixels | 2,560 × 1,804 pixels | 880 × 620 pixels.
Original file (SVG file, nominally 880 × 620 pixels, file size: 20 KB)
Captions
Captions
Add a one-line explanation of what this file represents
| Description |
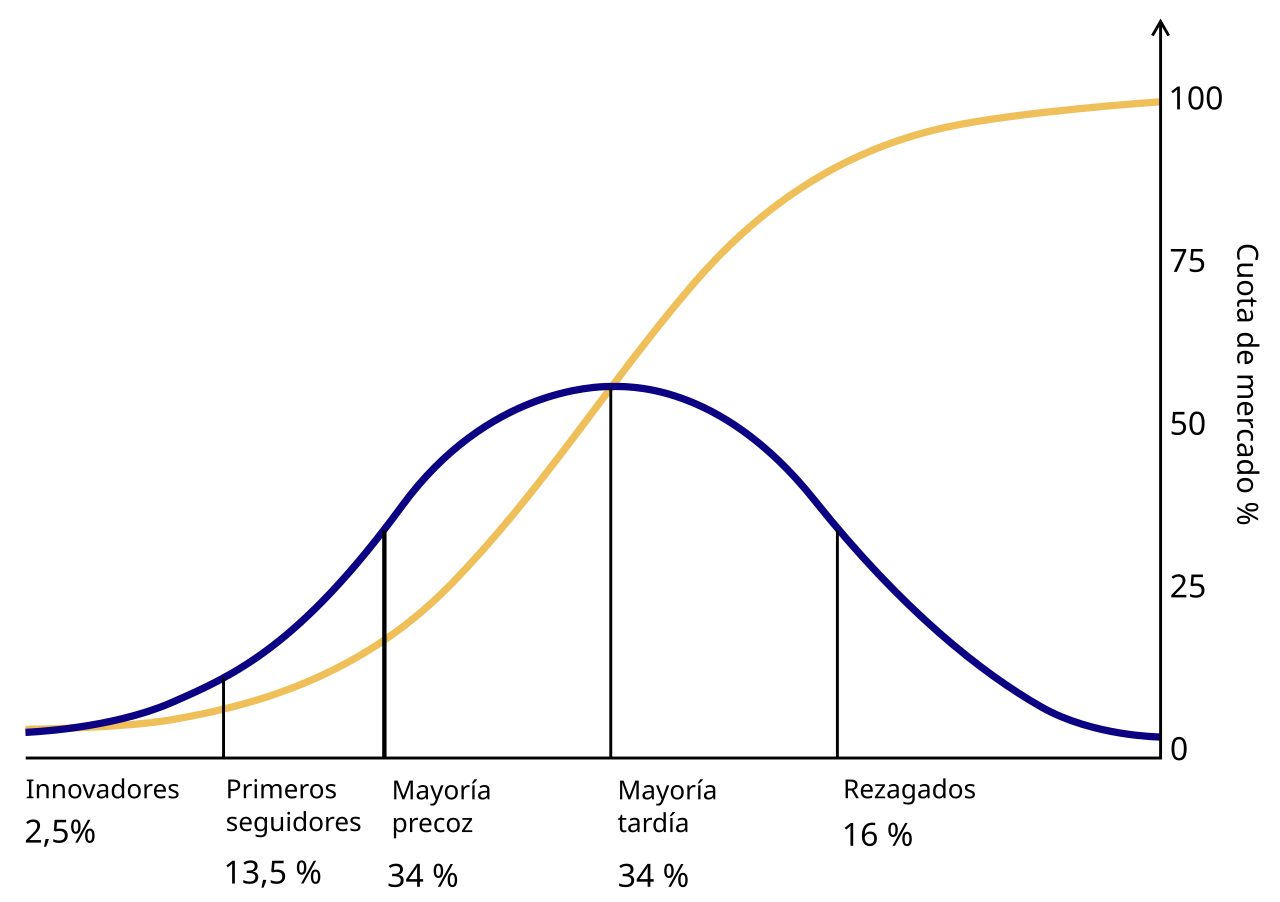
Español: La difusión de las innovaciones según Rogers (1962). En el gráfico en azul los grupos de adoptantes de nueva tecnología en sucesión, en amarillo la cuota de mercado hasta que finalmente se alcanza el nivel de saturación. English: The diffusion of innovations according to Rogers (1962). With successive groups of consumers adopting the new technology (shown in blue), its market share (yellow) will eventually reach the saturation level. (Labels in Spanish) |
| Date | (UTC) |
| Source | |
| Author |
|
| This is a retouched picture, which means that it has been digitally altered from its original version. Modifications: Vectorizado. The original can be viewed here: Difusióndeideas.png:
|
I, the copyright holder of this work, hereby publish it under the following license:
| I, the copyright holder of this work, release this work into the public domain. This applies worldwide. In some countries this may not be legally possible; if so: I grant anyone the right to use this work for any purpose, without any conditions, unless such conditions are required by law. |
Original upload log
[edit]
This image is a derivative work of the following images:
- File:Difusióndeideas.png licensed with PD-self
- 2010-12-22T21:19:25Z Osado 914x638 (58813 Bytes) {{Information |Description={{es|La difusión de las innovaciones según Rogers (1962). En el gráfico en azul los grupos de adoptantes de nueva tecnología en sucesión, en amarillo la cuota de mercado hasta que finalmente se
Uploaded with derivativeFX
File history
Click on a date/time to view the file as it appeared at that time.
| Date/Time | Thumbnail | Dimensions | User | Comment | |
|---|---|---|---|---|---|
| current | 15:13, 31 January 2011 | | 880 × 620 (20 KB) | Nicoguaro (talk | contribs) | Fondo blanco añadido, ya que se trata de un gráfico cartesiano. |
| 15:07, 31 January 2011 |  | 880 × 620 (20 KB) | Nicoguaro (talk | contribs) | {{Information |Description={{es|La difusión de las innovaciones según Rogers (1962). En el gráfico en azul los grupos de adoptantes de nueva tecnología en sucesión, en amarillo la cuota de mercado hasta que finalmente se alcanza el nivel de saturaci� |
You cannot overwrite this file.
File usage on Commons
The following page uses this file:
File usage on other wikis
The following other wikis use this file:
- Usage on ca.wikipedia.org
- Usage on es.wikipedia.org